 |
<
magnified
scene by clicking image
| Fig.1 |
image
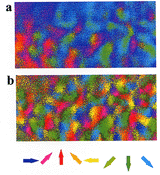
processing for direction columns A two-dimensional pattern (upper section) of
direction columns in area 18 obtained from an optical recording experiment before
applying our image processing method, and a two-dimensional pattern (lower section)
of direction columns from the same data after the removal of noise components
according to the method. |
|
Introduction
How does the brain work when we visually recognize the outside world? This laboratory
focuses on functional structures called columns, such as the orientation column,
ocular dominance column and direction column, which are located in the primary
visual area of the mammalian cerebral cortex. We aim to experimentally and theoretically
clarify information processing capabilities of the brain and the mechanisms underlying
the formation of neural networks which sustain these capabilities. We observe
two-dimensional patterns of various column structures using an optical recording
technique and study the mutual relationships among different columns and how the
columns represent information. At the same time, we study the role of visual experience
in the development of visual cortical columns, reproducing the experimentally
observed column structures by computer simulation based upon our mathematical
model of activity-dependent self-organization.
Analysis
of Optical Recording Data
Column structures which
represent different types of visual features are observed in the mammalian visual
cortex, and are
considered to provide functional reference maps for visual information processing.
To understand the mechanisms of visual information representation in the brain
and of visual information processing in the cortical neural circuits, column structures
are imaged using an optical recording technique. The optical recording we are
conducting is the so-called intrinsic optical signal recording, by which we can
detect changes in the morphology and metabolic activity of cortical cells associated
with neural activities as changes in the amount of light reflected from the brain
tissue. However, since signal components related to neural a ctivities
are faint, the obtained image data must be processed appropriately. Detailed analysis
of image data revealed that the main noise components that deteriorate the im
age of the columns are
stimulus-independent and spatially slowly-varying components. We
developed a method for image data processing, by which we can efficiently detects
stimulus-dependent signals b y
extracting the noise components using the orthogonal polynomial functions and
subtracting the components from the recorded signals. As shown in Fig. 1, a pattern
of direction columns representing optimal directions of motion in the frontoparallel
plane, which was m

magnified
scene by clicking image
| Fig.2 |
A
snapshot of a simulated spatio-temporal receptive field of a model visual cortical
neuron. Red and green domains, respectively, indicate regions within the receptive
field, which showed ON and OFF responses when stimulated with a spotlight. |
|
asked by noise and could
not previously be measured, can be imaged using this method.
A Model
of Activity-Dependent Self-Organization of Columns
How are the columns formed
in a developing brain? We approach this question using our mathematical model.
In the case of neurons in the lateral geniculate nucleus (LGN), which is a relay
nucleus in the thalamus, regions in the visual space which respond to
bright and dark light
stimuli (receptive field) are arranged in the form of concentric circles. On the
other hand, in receptive fields of neurons in the visual cortex, sub-fields responding
to bright and dark stimuli are arranged in parallel at different inclinations
for dif ferent
neurons. As a result, when a bright/dark-alternating stripe is presented to the
visual space, a cortical neuron respond selectively to the stripe presented at
a particular inclination (orientation). Meanwhile, since the receptive field properties
of adjacent neurons in the visual cortex are similar, orderly arrangements of
orientation and direction columns are found in the cortex. It has been found that
oriented receptive fields and the related columns, which are characteristic of
the primary visual cortex, can b

magnified
scene by clicking image
| Fig.3 |
A
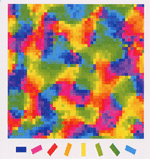
pattern of orientation columns in the model visual cortex obtained from the simulation
of activity-dependent self-organization. |
|
e reproduced by our mathematical
model of activity-dependent self-organization. This model is built based on Hebbユs
hypothesis that co-occurrence of pre-synaptic activity (spike a ctivity
of an LGN neuron) and postsynaptic activity (membrane depolarization of a cortical
neuron) strengthens the synaptic connection. Fig. 2 shows a typical example of
the spatio-temporal receptive field of a neuron in the model visual cortex, which
was obtained by performing simulation of self-organization while stripe patterns
with various inclinations were being presented. Fig. 3 shows a pattern of orientation
columns obtained by the same simulation.
A Column
Structure for Directions of Motion in Depth
It is considered that
orientation and ocular dominance columns, which have been conventionally imaged
by the optical recording technique, are basically determined by the feed-forward
connections from the thalamus to the cortex. However, if the representation of
visual information by a column is assumed to be determined by the afferent inputs
from the LGN, a question arises: what roles do an enormous amount of neural connections
within the cortex play in visual information processing? To answer this question,
we studied how information related to "directions
of motion in the depth direction"
is represented in the visual cortex, using intrinsic optical recording.
Movement of an object
in the depth direction is considered to be perceived based on the change in size
of an image which is projected on the retina or the difference in movement directions
between stimuli presented to the left and right eyes. We focused on the mechanisms
of the latter factor. We generated visual stimuli moving in the depth direction,
utilizing goggles equipped with liquid crystal shutters. When two sets of images
of a vertical stripe moving in opposite directions on a monitor are presented
to the left and right eyes alternately at 120 Hz, subjects feel that the vertical
stripe is moving in the depth direction. For example, when a stripe moving to
the right is presented to the left eye and a stripe moving to the left is presented
to the right eye, subjects feel that the vertical stripe is approaching. In contrast,
when a stripe moving to the left is presented to the left eye and a stripe moving
to the right is presented to the right eye, subjects feel that the vertical stripe
is moving away. We measured the intrinsic signals from the cortex when such stimuli
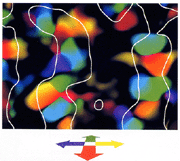
were presented to animals under anesthesia. Fig. 4 shows a pattern of columns
for directions of motion in depth, which was obtained from the recorded signals,
from which the aforementioned slowly-varying noise components were subtracted.
It has been revealed from detailed data analyses that the column structure cannot
be reproduced by any linear combination of signals in response to monocular stimulation.
This indicates that the individual neuronsユ optimal directions of

magnified
scene by clicking image
| Fig.4 |
A
pattern of columns for directions of motion in depth. A hue indicates the domains
of optimal directions of motion in depth, at which neural activities are significantly
facilitated. The white curves delineate the domains responding to the vertical
stripe. |
|
motion in the frontoparallel
plane are the same in the left and right eyes, and hence a single neuron cannot
code directions of motion in depth. In other words, motion in depth is extracted
by nonlinear interaction among visual cortical neurons, which is different from
the orientation and ocular dominance characteristics.
Conclusion
Based on the findings
from the self-organization study and intrinsic optical recording, we are developing
a large-scale neural network model taking into account mutual connections among
neurons in the cortex to understand computational mechanisms of the cerebral cortex.
By such a complementary and synergistic approach using theory and experiment,
we believe that some principles of cortical development and visual perception
will be clarified.
|
|
 |
|
|


