|
 |
 |
Functional Imaging : Mapping Intrinsic Signals of the Auditory Cortex
Laboratory for Visual Neurocomputing
|
|
|
A number of new imaging techniques have enabled us to directly visualize the functioning brain. Positron-Emission Tomography(PET)and functional Magnetic Resonance Imaging(fMRI)offer spectacular three-dimensional localization of active regions in the functioning human brain. Two another imaging techniques, electroencephalography(EEG)and magneto encephalography(MEG), have been developed to study the dynamics of cortical processing in the intact human brain. But while PET and fMRI offer low temporal and spatial resolution and EEG and MEG do not have adequate spatial resolution to resolve individual cortical columns, optical imaging of intrinsic signals has proven to be useful for visualizing, with high spatial resolution, the tangential representation of optimal stimulus features in many cortical areas.
Optical imaging of intrinsic signals detects small changes in optical reflectance of active brain tissue, which result indirectly from neuronal activity. At present, visualization of active cortical regions is at spatial resolutions greater than 0.1mm, since imaging of the functional architecture is based on slow intrinsic changes in the optical properties of active brain tissue. The sources for these activity-dependent intrinsic signals include changes in physical properties of the tissue itself and changes in brain tissue metabolism. Although to date, most optical imaging studies have been done in the visual cortex, this is by no means the only system, which can be studied using this method. Indeed, this methodology has also proven useful for investigating the functional architecture of the auditory cortex.
We used this technique to examine the cortical representation of sound feature encoding in the cat primary auditory cortex(AI), which is expected to be involved in sound source localization. In the recordings, sequences of pure tones or binaural clicks were presented to the left and right ears. We found not only tonotopic organization of sound frequencies, but also spatial representation of interaural time differences. Acoustic stimuli with different interaural time differences activated different localized domains in AI and the center of the activated domain shifted as the time difference was changed. We confirmed these observations in both optical imaging and electrophysiological recordings. Taken together with the idea that interaural time difference is an important cue for sound source localization, the data suggest that AI is involved in information transformation from interaural time difference to sound source location.
Figure 1 shows the tempolal change of the active domain in the primary auditory cortex in response to a 15 kHz frequency pure tone stimulus. Times from stimulus presentation are indicated in milliseconds. Over time, the activity amplifies, reaches its maximum after about half a second and then damps out.
As is well known, the basic structural principle of the auditory cortex is tonotopicity; the isofrequency domains appear in the form of stripes that are orthogonal to the rostro-caudal axis. The high-frequency domains are located in the rostral area and the low-frequency domains in the caudal area. We observed that using optical imaging, the isofrequency domains appeared not as stripes, but spots with irregular shapes. This distinction in the tonotopic map between intrinsic optical imaging and electrophysiological mapping may be explained as follows: In conventional electrophysiological mapping of tonotopicity, we explore the pure tone frequency that can evoke spike activities at the minimum level of sound pressure and define the optimal frequency. On the other hand, the optical imaging method is based on the presentation of acoustic stimuli at a suprathreshold sound pressure level. Therefore, the activation occurs not only at neurons for which a stimulus frequency is optimal, but also at other neurons with different best frequencies. The enhancement of neuronal activation induces a change of the activated area: the stripes change to spots.
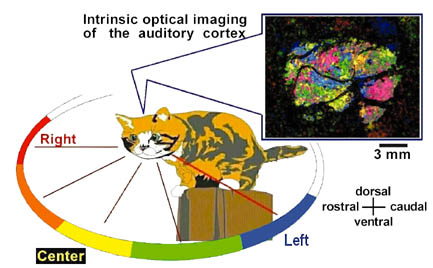
Optical imaging based on intrinsic signals is a method which allows investigators to map the spatial distribution of functional domains, and, in the case of imaging the auditory cortex, helps to answer to the question "Where is "where" in the brain?" This question about the computational ability of the cortex to define the spatial location of sound sources is one of the burning problems in neural network studies. Our data shows that the spatial distribution of sound sources is mirrored by the cortical activities and creates a pattern like "oriental carpet" where each color represents a specific azimuthal angle toward the object(see Figure 2)It is our hope that optical imaging will be a great help for computational neuroscientists.
Vassiliy Tsytsarev and Shigeru Tanaka, NeuroReport, Volume 13(13)1661-66 2002 |
| |
|
|
Figure 1
Temporal progress of evoked optical signals recorded at 540 nm of illumination from the primary auditory cortex in response to a stimulus consisting of five peeps of 15 kHz. |
| |
|
|
Figure 2
The cortical mapping of the spatial distribution of sound sources is shown by the different color (right - red, left - blue and yellow -center)
|
|
 |
 |
|
|