Introduction
Measurement of brain activity using MRI (Magnetic Resonance Imaging) equipment (fMRI) is currently being developed at an astonishing speed. After the first paper on fMRI (functional magnetic resonance imaging) dealing with humans was published in the latter half of 1991, the number of fMRI-related papers that were presented at international conferences held up to 1998 increased to beyond 200. The oldest method of performing external measurements of human brain activity is by the electro-encephalography, the next to come along was the PET method which made its debut in the mid-eighties. However, the usefulness of electro-encephalographic measurement is limited by its poor spatial resolution (the accuracy of determining the spatial position of each signal source).
When PET is compared with fMRI, the advantages of fMRI include; 1) more perfect non-invasive characteristics due to the absence of a subjectユs exposure to radio-isotopes, which makes the repeated measurement of a single subject possible; 2) better spatial resolution, and; 3) economically easy distribution thanks to the possibility of using ordinary clinical MRI systems which are already in use in the larger hospitals. The number of MRI systems with static magnetic fields of 1.5 Tesla already exceed 100 in Japan alone.
While most MRI systems are for clinical use and become available for night time and weekend research use only, many researchers already have the possibility of tackling the elucidation of hypotheses concerning the mechanisms of advanced human brain activity.
|
Principles of fMRI Measurement
Nevertheless, much remains unknown with respect to the biological measurement principles of fMRI. At present, all of the measurement techniques of fMRI measure local increases in the flow of blood that accompany any local increases in neural activity and from these observations estimate back to pinpoint the distribution of a specific neural activity. This process is based on the idea that an active nerve cell generates a certain signal, this acts upon and relaxes the muscle surrounding the arteriole (the blood vessel section between the artery and its branching capillaries). An increase in the blood flow from the arteriole to the downstream vessels is thereby caused (Fig. 1). In fact, however, the nature of the signal from the nerve cell to an arteriole and the mechanism of its function are still unknown. Whether the signal is generated as a result of blocking activity in the erve cell or as a result of synapse activity is also unknown. There is also a report of experiments suggesting the presence of blood flow regulation functions in the capillaries. The increase in blood flow increases the supply of glucose and oxygen to tissue and fills the metabolic requirements (to supplement the energy consumed by neural activities) of brain tissues exhibiting higher neural activity. In a study applying optical measurement to test animals the Integrated Neural Systems Laboratory (Headed by Dr. Manabu Tanifuji) at the BSI has shown that the flow of blood in the brain is regulated at an accuracy of below 0.1mm.
|
|
The most frequently used fMRI measurement technique is the BOLD (Blood Oxygenation Level Dependent) technique invented by Dr. Seiji Ogawa at the Bell Laboratories. Deoxygenated hemoglobin that has lost oxygen has a magnetic property (being magnetized in a magnetic field) but oxygenated hemoglobin that contains oxygen does not. As the deoxygenated hemoglobin in blood is magnetized in a magnetic field, it brings irregularity to the original magnetic field, disturbs the phase of proton spinning caused by magnetic resonance (MR) and causes the MR signal to decrease. When the local blood flow increases, more fresh blood containing only the oxidized hemoglobin is supplied, the deoxygenated hemoglobin concentration in the capillaries, venules and veins decreases (Fig. 2) and the MR signals of the protons increase. This result in a chain of phenomena from neural hyperactivity-increase in the local blood flow of the brain - decrease in the deoxygenated hemoglobin concentration - increases in the strength of MR signal.The BOLD technique estimates changes in neural activity based on increases in the number of MR signals by following and analyzing the above phenomena chain in the reverse order.
|
- |
| Fig. 1 | Increases in local blood flow accompanying increases in neural activity |
|
| Fig. 2 | Decrease in deoxygenated hemoglobin following an increase in blood flow |
|
Advantages of fMRI in Strong Magnetic Fields
In the past, fMRI research has been carried out using MRI systems with a static magnetic field of 1.5 Tesla, and the spatial resolution in measurements has been 2mm or worse. A spatial resolution of 2mm is enough for checking the functional division per cerebral cortex area (mostly with a size of 5mm or larger), but not enough for identifying how information is expressed and computations done in each area. While measurement at the cellular level will eventually be required to answer the latter problem, it is for the present not practical to try to develop a non-invasive cellular level measurement technique which operates externally to the brain. Resolutions of 0.5mm or so seem to be achievable by improvements to the current fMRI technique, and it is expected that a big breakthrough will be brought to brain science research when this is achieved. This is because the structures in which cells with similar properties are gathered, named the column structures, have been discovered in some locations in the cerebral cortex and these structures have sizes of around 0.5mm.
Increasing the static magnetic field strength from 1.5 Tesla to 4 Tesla has the potential of improving the spatial resolution. As the magnetic susceptibility of the magnetic substance (protons in this case) is proportional to the static magnetic field, the MR signal will generally increase, and the increase in the signal level will improve the signal-to-noise ratio (SNR) and the spatial resolution. In addition, it is also expected that the BOLD signal source itself will be able to be better localized by the strong magnetic field. It has been demonstrated by theoretical considerations that the signals from the veins and venules increase in proportion to the strength of the static magnetic field, while those from the capillaries increase in proportion to the square of the strength of the static magnetic field. However, fMRI in a strong magnetic field also presents disadvantages such as the short attenuation time of MR signals and the loss of signal or image distortion due to magnetic field irregularities in the brain regions around the ears and nose where air is present close to the brain tissues.
Examples of fMRI Measurements
Under the initiative of the Cognitive Brain Mapping Laboratory, the BSI is developing technologies for implementing fMRI with spatial resolutions of below 1mm by introducing an MRI system with a static magnetic field of 4 Tesla. By postponing the introduction of measurement results showing spatial resolutions of below 1mm for the time being, let us introduce in the following two examples of measurements using ordinary spatial resolution.
Fig. 3 shows the brain activity distribution when a healthy subject recognizes faces. The subject is shown the pictures of well-known faces of actors and politicians and answers the names of these celebrities without using the mouth (because moving the mouth will mix noise with the image). The brain regions where activity increases in a statistically significant manner compared to the activity when the subject sees a meaningless pattern are indicated using yellow and red spots on the brain structure image. The figure shows that the activity increase is observed in the lower part of the cerebrum potero-temporal region.
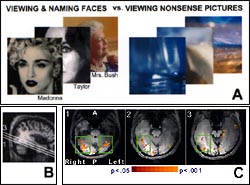
| Fig. 3 | Activity in the lower part of the cerebrum potesro-temporal region. |
| A: | Examples of the faces of celebrities and of meaningless patterns used in the tests |
| B: | Positions of 3sections of the brain obtained by fMRI measurements, shown in a sagittal place |
| C: | Yellow and Red points showing the brain regions where activity increased with statistical significance during the recognition of known faces |
|
- |
Fig. 4 shows the activity of the motion related areas of the cerebrum during hand finger exercises. Comparisons of the effects on the brain between the time when the subject stayed still without moving the hands and those when the fingers were engaged in complicated exercise activity were observed in the pre-motor area and the supplementary area, in addition to the activity in the primary motor area.
Conclusion
The dissemination of fMRI makes it relatively easy to measure the spatial patterns of human brain activities. fMRI measurements using a variety of psychological paradigms are already active and technologies for improving the spatial resolution of measurements are being developed. There are great research expectations from two aspects, these are, in identifying how far past results obtained from animal tests are applicable to humans and to identify the mechanisms of ultra-high brain functions available only from researches into humans. Nevertheless, there is for the present no perspective that measurements at the level of the cell can be implemented using fMRI or any other new non-invasive measurement technique. And the research using test animals cannot be replaced entirely with the research on humans. It is expected that the research using test animals and the research on humans using non-invasive techniques will play a mutually complementary role in the development of brain science.
|
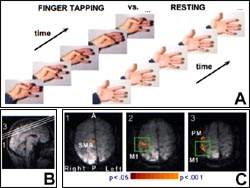
| Fig. 4 | Activity in motion related areas during complicated finger exercises of hands |
|
|