Introduction
The Laboratory for Neuroinformatics was established in 2002 with the aim of developing essential technologies for further promotion and support to understand the brain in the IT era. Then, in 2005 the International Neuroinformatics Coordinating Facility (INCF) was established following recommendations of the Organisation for Economic Co-operation and Development (OECD). Following this, the Japanese Ministry of Education, Culture, Sports, Science and Technology (MEXT) approved the establishment of the Neuroinformatics Japan Center (NIJC) at BSI, as the organization responsible for the establishment and operation of Japan Node under the INCF. In the late 90s, the Decade of the Brain project (1990-2000) involving leading universities and massive budget in the US was approaching its final stage, and research in Neuroinformatics such as databases for imaging data, morphological data, and others have being developed.
In Japan, Neuroinformatics Research in Vision (NRV) was promoted as a pilot project under the Strategic Promotion System for Brain Science of the Special Coordination Funds for Promoting Science and Technology at the MEXT (1999-2004)[1]. The Visiome Platform developed in this project has been publicized as a leading platform of the Japan Node[2].
To support this endeavor, our laboratory has been developing neuroinformatics tools to contribute to the advancement of this field in Japan, while at the same time monitoring trends in other countries.
Neuroinformatics based platform system: XooNIps
The Visiome Platform is an achievement resulting from 5 years of effort by the NRV project team and is regarded as the basis for the future development of neuroinformatics in Japan. Based on the specification and function of the Visiome Platform, we have developed the XooNIps, a base platform system which facilitates the establishment of new platforms with improved functionality and extensibility. XooNIps is an Open Source Software project hosted at Source Forge Japan[3].
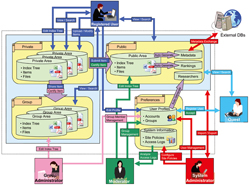
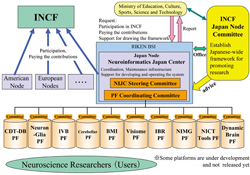
XooNIps can be utilized from personal use, to small groups such as laboratories, up to a large community like public platforms (Fig. 1), and at present, there are nearly 10 such platforms running under the Japan Node (Fig. 2). The flexibility of XooNIps is further demonstrated by its user for the development of organizational repositories of libraries and research institutions, taking as example the KOARA[4] at the Keio University Media Center.
The XooNIps has also gained popularity among private companies due to its easy to use interface compared to similar tools such as D-Space. RIKEN is also considering the XooNIps as the base platform for laboratory databases, institutional repository, and integrated databases. We are also expecting a global dissemination of XooNIps.

Personal digital content management tool: Concierge
The large amount of digital information such as PDF files of research documents, experiment data, etc., requires efficient digital data management on a per-person basis. Moreover, uploading research data to a public platform may also promote scientific research, which is another objective of Neuroinformatics.
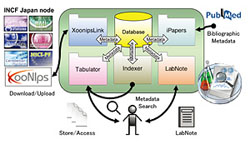
For this reason, we have developed the Concierge, a personal database solution of the researcher, by the researcher, for the researches, which is available as freeware[5]. It includes features such as laboratory notebook, paper management where PDF files are managed together with information such as bibliographic metadata retrieved with the help of its PubMed ID, manage experimental files with information on experimental conditions, and using its feature to link with XooNIps, files can be easily uploaded to an open database (Fig. 3).

Graph plotting tool: Samurai Graph
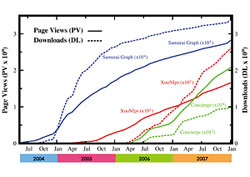
Graphical representation of experiment data is a work that no researcher can avoid. Commercially available graph-plotting tools are not compatible to each other. In order to deal with this issue we have developed the Samurai Graph, also available as a freeware[6]. Researchers can easily create and edit graphs on-screen. Fig. 4 shows a graph drawn representing the usage of the tools that have been introduced in this article. The Samurai Graph site has been accessed hundreds of thousands of times, and has received much praise from many users. As Samurai graph is Java-based it is available on all platforms providing Java support.

3D visualization tool: 3D-SE Viewer
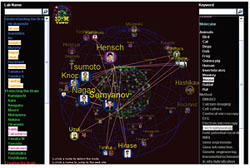
Huge amounts of data are stored in data bases, such as in neuroinformatics platforms. How can the user grasp the entire content of a database, browse or obtain the required data easily? In order to address this requirement we have developed a visualization tool based on a spherical embedding method and have published the BSI Team-Map (Fig. 5) as an example of its application on the BSI webpage[7]. Here, laboratory heads are positioned in the outer sphere, and keywords on the inner sphere, where the nodes are optimally positioned according to the similarity between each other. It can be rotated or zoomed in or out using the mouse, and laboratories can be searched by clicking the nodes.
In the future, application of the 3D-SE Viewer for the visualization of the contents of NIJC platforms, as well as of databases of papers published by BSI researchers is expected. In addition, the PubMed Plus committee of the Society for Neuroscience (SfN) is considering the development of a new tool for the visualization of the abstracts presented at the SfN annual meetings.
Conclusion
Brain scientists may not be aware of the meaning of Neuroinformatics. However, in this era where no research can be conducted without a computer and internet, and especially that no overall dynamics of brain function can be elucidated without sharing and integration of research data, we hope researchers will understand the importance of Neuroinformatics. However, Informatics is not limited to Neuroscience and publication of scientific papers, experimental data, etc. is essential for the advancement of any scientific field. In addition, the importance of institutional repositories is expected to increase from the aspect of management of intellectual properties. I hope that the tools introduced here would be useful for your daily information management needs.


