Background
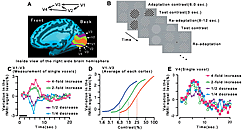
Fig. B: Visual stimulation paradigm for the investigation of responses to contrast variations under various adaptation states.
Fig. C: Example of responses to contrast variations, recorded from voxels in V1, V2 and V3.
Fig. D: Contrast-response functions, plotting the response peak values with respect to the response signal levels before applying the adaptation stimulation, showing the response from three different adaptation states by means of traces in different colors.
Fig. E: Example of response recorded from a voxel in V4.
The primate brain processes visual signals from the retina first in the primary visual cortex (V1) at the rearmost position of the occipital lobe. After additional processing in the higher level visual cortices (including the secondary visual cortex (V2), tertiary visual cortex (V3) and quaternary visual cortex (V4)) (Fig.A), the signal moves to association cortices in the inferior temporal lobe and parietal lobe.
When various stimulations in brightness contrast are applied to a monkey visual cortex while recording its neural cell activity, neurons are seen to respond weakly to weak contrasts and more strongly against stronger contrasts. However, the contrast range in which each neuron's response changes is limited. Once exceeded, the magnitude of response changes little even when contrast changes.
Nevertheless, humans can detect a wide range of contrasts. When we are accustomed to viewing stimulations of strong contrast, we will be able to distinguish the difference in strong contrast levels. Once accustomed to simulations of weak contrast, we can discern in finer differences among weak contrast levels. To be able to do this, the contrast range to which each neuron dynamically respond must be able to adapt to the average contrast level of the current environment.
Research Technique, Results
In order to study where contrast adaptation takes place in the human brain, we tested human subjects using functional magnetic resonance imaging (fMRI) on contrast adaptation. In the test, we used visual stimulations composed of 15 times of reversals of black and white in a checkerboard pattern (Fig.B). When a 60-second adaptation stimulation was presented with 13% contrast, for example, followed by a 3-second stimulation having a contrast that was four times stronger, the signal from the visual cortex increased temporarily (Fig.C). However, when we applied stimulation with a weaker contrast, the signal level dropped temporarily in the areas from V1 to V3 (Fig.C). We then plotted peak levels of the response signals produced by test stimulations at various contrast levels with respect to the signal level before presentation of the adaptation stimulations. As a result, we obtained a sigmoid-shaped, contrast-response curve (green line in Fig.D).
If the contrast of the adaptation stimulation increased to 25%, for example, the signal from the visual cortex increases temporarily but returns to near-original levels after about 50 seconds. While the visual cortex in this adaptation state, we applied test stimulations at various contrast levels and plotted the response peak values. We observed that the contrast-response curve shifted to the right (red line, Fig.D). When contrast levels decreased to 6.3%, as shown in the example, the contrast-response curve shifted toward (blue line in Fig. D). These results suggest that the adaptation changes the response range in V1, V2 and V3 dynamically in response to the contrast levels of the current environment.
In addition, this study also led us to an unexpected finding: In V4, that is the highest among the tested visual areas (Fig.A), the response signal increased both when the contrast used in test stimulations was incremented or decremented (Fig. E).
Significance of the Research
Previous fMRI investigations focused on aspects of brain functions that do not vary over time. However, here we focused on dynamic aspects of brain function, the adaptation to contrast by developing an original event-related measurement technique. We were able to show that adaptation to contrast occurs early, in the primary visual cortex (V1). In addition, the present research also suggests that V4 neurons do not respond to contrast variations, rather they appear to detect that a change has occurred.


