


Introduction
The Laboratory for Human Brain Dynamics (LHBD) uses non-invasive methods to study human brain function. Ongoing projects focus on elucidating how simple sensory stimuli are processed and use this information to explore how emotions and higher cognitive functions, including artistic appreciation, are expressed by neuronal activity across the entire brain.
Methods and Background
Magnetoencephalography (MEG) is the tool of choice in our laboratory. MEG deals with the detection and interpretation of the minute magnetic field generated by the electrical activity of neurons in the brain. The MEG signal travels the small distance from the brain to the sensors at the speed of light and it can be sampled from well over 100 points around the head millisecond-by-millisecond or faster. To explain the highly variable response to identical stimuli many researchers accepted the concept of a random brain activity, aptly labeled "brain noise". The "signal plus noise" model of brain function provided the logical justification for the use of averaging of MEG data. We have looked at the origin of this variability using magnetic field tomography (MFT), a technique capable of millisecond-by-millisecond tomographic estimates of activity throughout the cortex, cerebellum and brainstem. The MFT solutions showed a non-linear coupling of background brain activity and evoked responses providing some of the strongest refutations of the "signal plus noise" view of brain function.
How well can MEG localize?
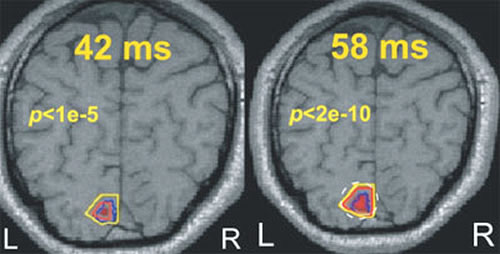
The question of localization in MEG is usually addressed by testing how well one or more point-like generators can be recovered from computer generated MEG data, or from real data obtained by averaging a large numbers of simple sensory stimuli. These approaches are largely irrelevant because the model of one or few point sources does not adequately represent biological reality. To meaningfully address the question of localization, we blended our knowledge of the visual system and the fMRI expertise of our colleagues in the Cognitive Brain Mapping group. We compared time-dependent statistical parametric mapping (SPM) images derived from our MFT solutions with similar images derived from fMRI data. Using identical stimuli, and the same four subjects, we have shown remarkable agreement for the activation of the primary visual cortex, V1. The post-MFT statistical parametric maps (SPM) around 40 ms after stimulus onset were within a few millimeters of the fMRI SPMs (Fig.1). Within a few milliseconds the post-MFT SPMs show widespread activity in extrastriate areas. Next, a new wave of V1 activity was seen again just after 50 ms leading to the well-known peak at 70 ms. In further work, we have used the knowledge of human eye movement process to test localization in the cerebellum and brainstem demonstrating enough sensitivity to separate the gaze centers across the midline (Ioannides et al., Cerebral Cortex 14:56-72, 2004).

Early sensory responses
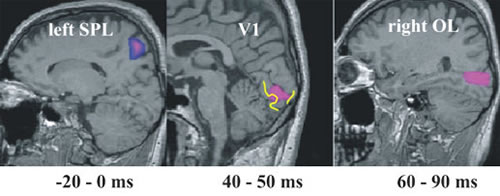
Accurate localization of single trial MEG data provides new insights into the role of primary visual areas in processing external stimuli. In the visual system we have identified an attentional modulation in V1 well within 100 ms. Our MFT analysis identified increased activity in the superior Parietal Lobule (SPL) when attention was required before the stimulus onset (Fig. 2). SPL activity was identified in fMRI experiments when a stimulus was omitted. In the somatosensory system we have identified a time-dependent response in the primary somatosensory cortex, SI. During the first few hundred milliseconds the activity in SI is driven exclusively by the properties of the stimulus, but after half a second the activity of SI reflects what the subject thinks the stimulus is, even while a different external stimulus is present (Fig. 3). In the auditory system, we identified a clear asymmetry in the responses to simple tones related to different echoic memory traces in the left and right hemisphere. This laterality effect depends on handedness and gender (Ioannides et al., NeuroImage, 19:1061-1075, 2003).
Stages of processing
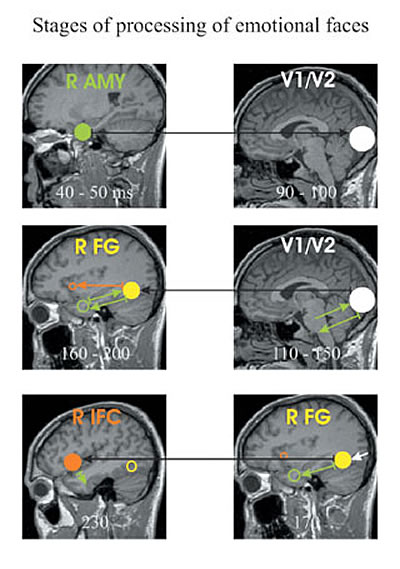
The response of a normal brain to complex stimuli can be described in terms of stages of processing involving networks of interacting areas. We have studied stages of processing for tasks demanding the recognition of facial expressions of emotion. In normal subjects an interaction was established between weak and very early amygdala activation (within 50 ms) and V1 (around 80 ms), but this linked activity was absent in people with schizophrenia. The concept of stages of processing has been particularly useful when the later activations were examined. In normal subjects interactions between brain areas are grouped together into distinct stages of processing which follow each other in sequence (Fig. 4). In people with schizophrenia the same tasks lead to strong regional activations but isolated links between areas that lack organization and do not form complete stages of processing.
On dreams and music
Our MFT solutions from MEG data recorded during rapid eye movement (REM) or "dreaming" sleep, showed a sequence of activations preceding REM saccades. The sequence began in the orbito-frontal cortex, and continues through the amygdala and parahipocampal gyrus preceding the brainstem commands for the eyes to move. A brief interruption of activity in V1 was followed by a clear reactivation around 200 ms after saccade onset. During REMS the reactivation of V1 was followed by activations of the left and right amygdala (Ioannides et al., Cerebral Cortex 14): 56-72, 2004).
For our music experiments we have used authentic music and developed dedicated analysis tools to capture and match temporal patterns in the music score and the regional brain activations (Popescu et al., NeuroImage 2004). As expected, our results showed that music excites very widespread brain regions. The early auditory areas respond to the onset of a music stimulus in much the same way as to any other auditory stimulus. A few seconds later a more widespread activation emerges over widespread brain areas, and especially in the cerebellum, motor areas and the frontal cortex. The motor related areas respond to rhythm while the frontal lobes act as integrators working at longer timescales, possibly linking together simple music segments to more "meaningful" and organized temporal patterns. Log in on our web site ( http://www.hbd.brain.riken.jp) to hear the sound and marvel at the animations of the brain reveling in the music.
What is the common theme?
The MEG signal and even the real time activity of any one area appear random from the blinkered viewpoint of just one node of the network, but examined in the right way, the combined activations reveal an ingenious way of organizing complex tasks into stages of processing where slightly different areas at slightly different times are recruited, each time a given task is tackled. In some pathological conditions this complex organization seems to fail. At the opposite extreme, when we dream or when we enjoy art, these processes combine in an exquisite harmony to bring into one unified act perception, emotions and consciousness.
The laboratory for human brain dynamics welcomes suggestions for collaborative studies. Ideal projects would have experimental designs that have already produced robust behavioral results to be clarified in terms of the loci and timing of regional brain activations and interactions between them by studying very few subjects with our very time-consuming data processing and analysis methods.
